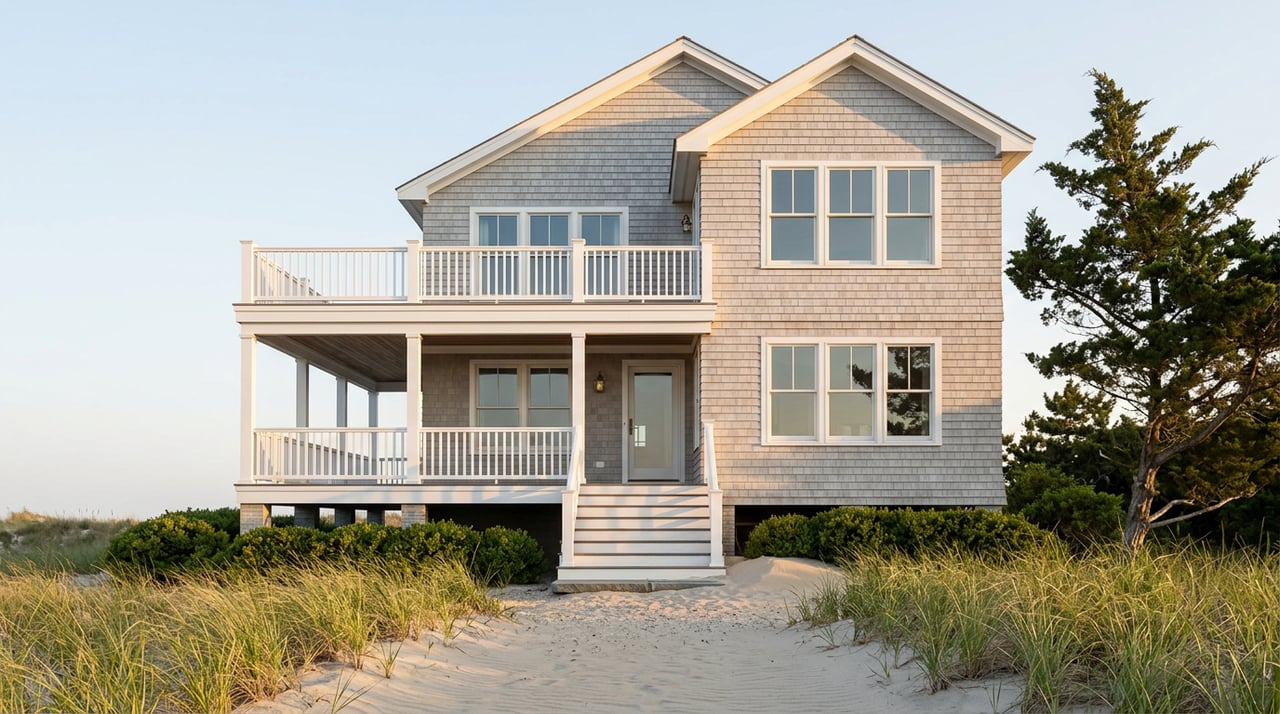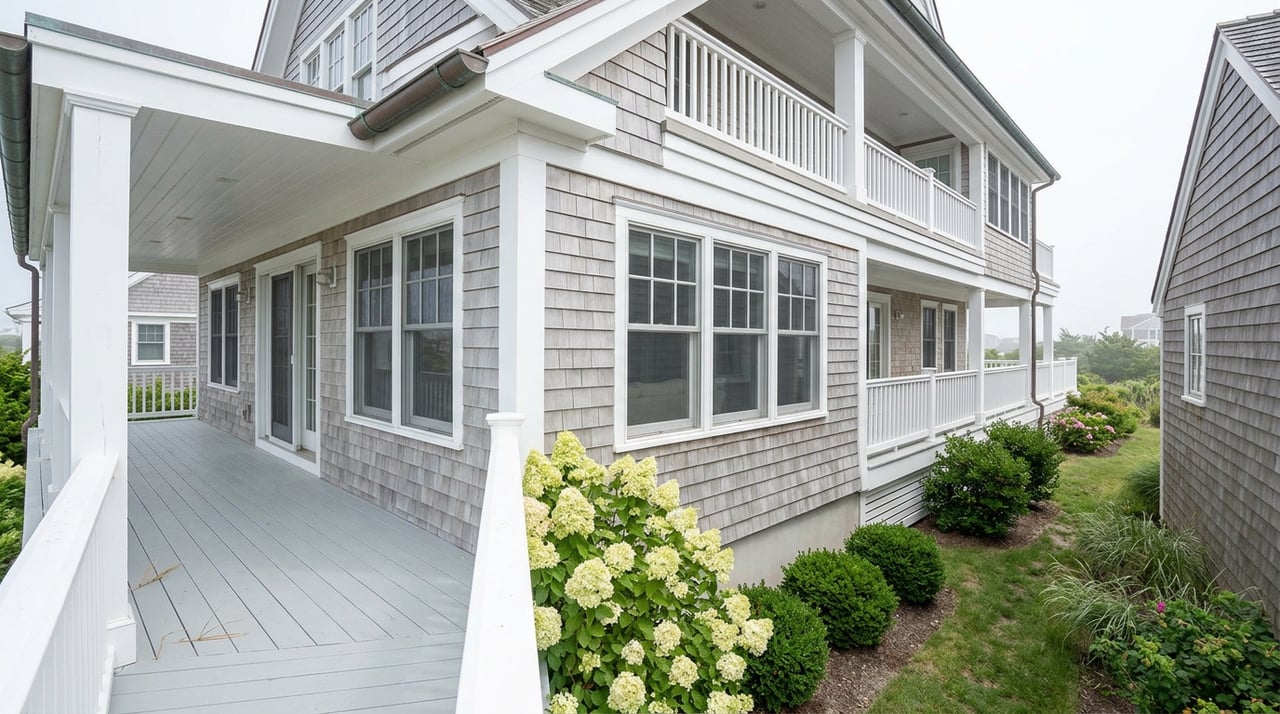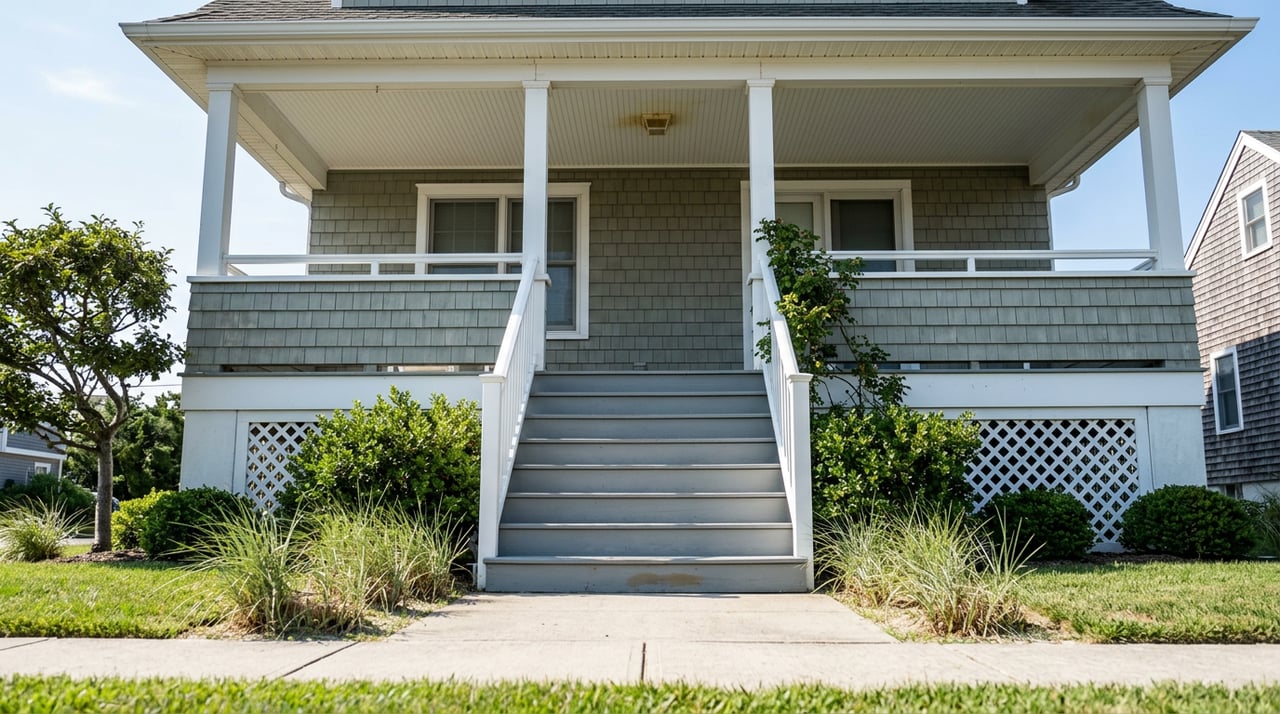
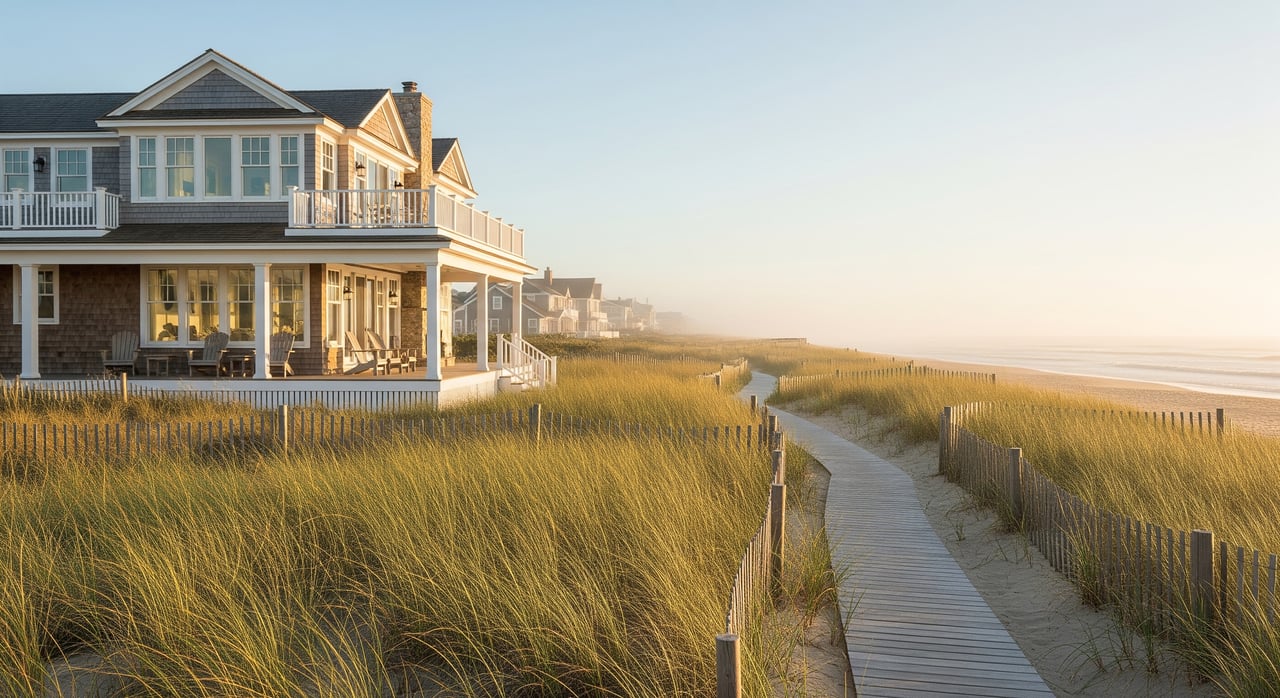
Is your Ocean City, NJ search or sale hinging on the "right" time? You're not imagining it. Shore real estate runs on a seasonal rhythm that changes how many homes you'll see, how fast offers move, and what terms sellers accept — and in 2026, that rhythm is being shaped by some of the tightest inventory the island has seen in two decades, a buyer pool that's 55–60% cash, and new state-level construction rules that are reshaping what's worth buying.
In this guide, you'll learn how Ocean City's market shifts month by month, what current data tells us about timing, and how to plan your move with confidence. Let's dive in.
Ocean City Seasons at a Glance
High season runs from Memorial Day through Labor Day. Tourism peaks, weekly rentals hit 95%+ occupancy through July and August, and in-person showings surge as vacationing buyers tour the island in person.
Shoulder seasons span March to May and September to October. Activity builds quickly in spring, and meaningful demand continues into fall — driven by events like the Fall Block Party and the Corvette Show, plus families and second-home buyers hunting off-peak opportunities.
Low season is November to February. Foot traffic falls and some sellers pause listings, but motivated buyers find more negotiating room — with the list-to-sale ratio sitting around 97.6% during winter and early spring versus 99.1% at the summer peak.
Seasonality affects more than open houses. Lenders, inspectors, contractors, and movers all book up during spring and summer, which directly impacts scheduling and closing timelines. Understanding these cycles helps you set the right expectations and choose strategies that work.
Month-by-Month Patterns
Winter: November to February
Inventory is typically lower as many sellers pause listings or plan for spring. Showings happen by appointment and may work around off-season rentals. With fewer active buyers, offers tend to include more favorable contingencies and concessions. Buyers in this window can often negotiate 2–3% off list price, compared to nearly full-price deals in peak summer.
If you're selling, winter can still work if you focus on presentation and flexibility. Highlight year-round systems, current flood insurance premiums, and operating costs, and use strong media to help buyers picture summer living. Expect a smaller buyer pool but also less direct competition from other listings.
Early Spring: March to April
Listings start to rise as sellers aim to catch spring demand. Weekend showings increase and online search activity picks up as buyers research ahead of the beach season. Competition grows for well-priced homes, especially in the $750K–$1.5M condo and duplex range where financed buyers are most active.
Sellers who go live in March or April often capture early-bird interest and can set the pace before peak summer. Buyers face more competition than winter but fewer bidders than late spring and summer.
Late Spring: May to June
Selection broadens as many owners list before the rental season or aim to close ahead of July and August travel. In-person touring is brisk, with many buyers coordinating showings during shore visits. Offers move faster, especially on turnkey, waterfront, or rental-ready homes — and on premium listings over $3M or new construction, properties frequently sell at 100%+ of list price, sometimes before completion.
If you're financing, build in buffer time. Appraisers, inspectors, and lenders are busy, and popular contractors book quickly for repair requests. Planning ahead protects your closing timeline.
Peak Summer: July to August
Listings stay high, but showings may be restricted because of occupied weekly rentals. Vacationing buyers are active and often ready to act on homes with strong rental income potential or immediate lifestyle appeal. Competition can be intense on certain property types — particularly Gold Coast (15th–34th Streets) and North End rental-ready homes.
Tenant occupancy may limit access and extend closing timelines. Some buyers make offers based on detailed virtual tours or during narrow in-person windows, then include contingencies for a final walkthrough or inspection.
Early Fall: September to October
Activity stays meaningful after Labor Day, with some sellers returning to market and others adjusting pricing. Buyers seeking a more relaxed pace may find room to negotiate while still having varied options. Families who prefer to move outside peak summer sometimes target this window.
Contractors often have improved availability in fall, which can help with inspection repairs or post-closing updates. If you want better scheduling and potential savings, this can be a smart time to buy.
Late Fall into Winter
As the holidays approach, traffic slows and patterns revert to the winter rhythm. Some buyers use this quieter period to research, preview virtually, and write offers that close in early spring. Sellers who need to transfer before the new year may be more flexible on terms.
Best Timing for Sellers
- List before Memorial Day to maximize exposure. Early spring through early summer typically delivers the best mix of buyer traffic and willingness to pay. Days on market drop meaningfully during this window, and list-to-sale ratios climb closer to 99%.
- March to April launches often capture momentum. You'll reach spring and early-summer shoppers and may spark multiple showings quickly — especially important now that the share of homes selling above list has dropped to 15% (down from nearly 50% in 2022), meaning pricing strategy matters more than ever.
- If you rely on summer rental income, consider late fall or winter. You'll protect in-season bookings worth $35,000 to $100,000+ depending on property type, but expect a smaller buyer pool and possibly longer days on market.
- Elevate marketing. Use professional photos, video, and drone media, plus clear documentation of rental performance for income-minded buyers. In winter, spotlight year-round systems, the city's CRS Class 4 flood insurance discount (a 30% premium reduction), and carrying costs like Ocean City's effective tax rate of 0.640%.
- Price for the season. Enter spring competitively to draw strong interest fast. In winter, show flexibility on timing and inclusions to meet motivated buyers where they are.
Best Timing for Buyers
- For the most negotiating power, try late fall through winter. You'll often face fewer competing offers, more room on terms, and a list-to-sale ratio closer to 97.6% versus the 99%+ seen in peak season.
- For the widest selection, shop late spring into early summer. You'll see more inventory and rental-ready homes, but be ready for faster decisions and tight timelines — current months of supply sits at just 3.35.
- Planning around school calendars? Start your search in January to March to close in June to August. Build in time for inspections, appraisal, and any repairs.
- Buying for rental income? Touring in late spring and early summer shows the rental market in action. A well-positioned 3-bedroom can generate $35,000–$42,000 annually on Airbnb, while top-tier oceanfront homes through local agencies like Berger, Monihan, or Goldcoast Sotheby's can exceed $100,000.
- Watch the financing math. With 30-year jumbo rates sitting between 6.13% and 6.50% in May 2026, many financed buyers are breaking even or running slight negative cash flow monthly — banking on appreciation and depreciation tax benefits rather than immediate profit.
Ocean City Factors That Shape Timing
Short-term rentals and local rules. Ocean City's seasonal economy makes rental performance central to many purchase decisions. All rentals require an annual Mercantile License through the City Clerk's Office, which includes a $500,000 liability insurance minimum and fire safety inspections. As of late 2025/early 2026, the city also imposes a new 3% municipal transient accommodation fee on rentals booked through platforms like Airbnb and Vrbo — though bookings through licensed NJ real estate agents remain exempt. A proposed 5-night minimum stay was narrowly defeated in mid-2025, but the city's "three strikes" rule (three documented disturbance calls within 12 months) can suspend a rental license for up to 30 days. Confirm current requirements at ocnj.us/mercantile or by calling (609) 399-6111.
Flood risk and insurance. Most of Ocean City sits in FEMA AE or VE flood zones. Under Risk Rating 2.0, premiums are calculated by individual property characteristics rather than flat zone designations. The island's average NFIP premium runs $626–$850 annually, but ground-level bayfront or beachfront homes can exceed $3,500. Ocean City's Class 4 CRS rating delivers a 30% premium discount — one of the highest in New Jersey — saving island owners more than $3.9 million annually. Always ask for the property's Elevation Certificate before writing an offer.
The new NJDEP "REAL" rules. Finalized in early 2026, New Jersey now requires the lowest floor of all new construction and substantial improvements to be elevated 4 feet above the FEMA Base Flood Elevation. If a renovation exceeds 50% of the structure's value, the city will require the entire home to be lifted to meet the new standard — a critical consideration for buyers eyeing older 1960s–70s cottages.
Property systems and maintenance. Seasonal HVAC use, bulkheads, seawalls, and dune management influence upkeep and costs. New bulkheads must now be built to 8.0 feet (NAVD88), with replacement costs ranging from $30,000–$55,000 for a typical 40-foot bayfront parcel. A home with a failing bulkhead can be discounted 10–15% in the current market.
Property taxes. Ocean City's effective tax rate of 0.640% is roughly one-fourth the New Jersey state average, making the island's carrying costs surprisingly competitive — a $1.5M home carries about $9,600 in annual taxes, often less than a $600K mainland home in nearby Somers Point or Upper Township.
Neighborhood micro-markets. The Gardens commands a median list price of $3.795M with sale prices often above $1,600 per square foot. The South End sits around $1.525M, the North End around $1.287M, and Central — the most accessible — around $949,900. Bayfront values have surged to near-oceanfront parity, with direct bay frontage and a dock now starting around $2.5M.
Interest rates and the broader economy. Mortgage shifts amplify or dampen seasonal patterns year to year. In 2026, jumbo rates are actually running slightly below conforming — a reversal of historical norms that benefits Ocean City's high-balance buyers.
Smart Logistics in Peak Season
- Plan showings early for vacation-occupied homes. Weekly turnovers (typically Saturdays) and tenant privacy can limit access to short time windows.
- Add buffer to your schedule. Inspectors, appraisers, lenders, and movers are busiest in spring and summer. Extra time protects your closing date.
- Use virtual tools wisely. If you're out of town, lean on live video walkthroughs, rich media, and sight-unseen clauses with inspection or final-viewing contingencies — common practice for buyers in the Philadelphia metro, North Jersey, and NYC suburbs (which together account for roughly 80% of Ocean City buyers).
- Coordinate around local peak weeks. Avoid high-traffic weekends like the Fourth of July and major holidays when possible to reduce delays and stress.
How The Cheryl Huber Team Helps
Cheryl Huber has been the #1 expert serving Ocean City since 1985 — four decades of guiding buyers and sellers through every type of shore transaction, from entry-level condos to luxury new construction in The Gardens. Backed by Berkshire Hathaway HomeServices Fox & Roach, Cheryl leads a team of four agents and two specialty coordinators who handle every detail with care.
For sellers, that means planning the right launch window, shaping pricing and terms for the season, and presenting your property with marketing that resonates with shore buyers — including the 81–85% who are buying second homes or investment properties. For buyers, that means streamlined touring, preparation for fast-moving spring and summer moments, and an offer strategy aligned with the market's monthly rhythm.
Multi-agent coverage keeps you supported during busy weekends and holidays, and the Berkshire Hathaway HomeServices affiliation amplifies your listing's reach across the Philadelphia metro, North Jersey, NYC suburbs, and beyond. Whether you're targeting a turnkey condo, a Gold Coast duplex, or a Gardens estate, the team helps you time the move that fits your lifestyle and financial goals.
Ready to plan your Ocean City move with confidence? Contact The Cheryl Huber Team at (609) 602-2322 or [email protected] to find your perfect shore home.
FAQs
When is peak competition for Ocean City buyers? Late spring through summer, roughly May to August, when in-person visitors, second-home buyers, and investor interest are highest. Months of supply is currently around 3.35, well inside seller's-market territory.
When do Ocean City sellers often get the best results? Early spring into early summer typically balances strong buyer traffic with willingness to pay, with list-to-sale ratios climbing toward 99.1%. Listing before Memorial Day is often recommended.
How do summer rentals affect showings and closings? Tenant-occupied homes may limit access and extend timelines, since weekly rentals run 95%+ occupancy through July and August. You may tour during narrow windows or use virtual tours, then include contingencies for final inspections.
Should flood insurance influence my timing in Ocean City? Pricing doesn't change seasonally, but Risk Rating 2.0 makes individual property factors — elevation, distance to water, foundation type — far more impactful than they used to be. Always request the Elevation Certificate and factor the city's 30% CRS discount into your numbers year-round.
Is winter a good time to list a shore home? It can be. You'll face a smaller buyer pool but also less listing competition, and motivated buyers may seek flexible terms and quicker negotiations. The list-to-sale ratio in winter (97.6%) is only modestly below peak (99.1%), so well-priced winter listings still perform.